hotel-business-center

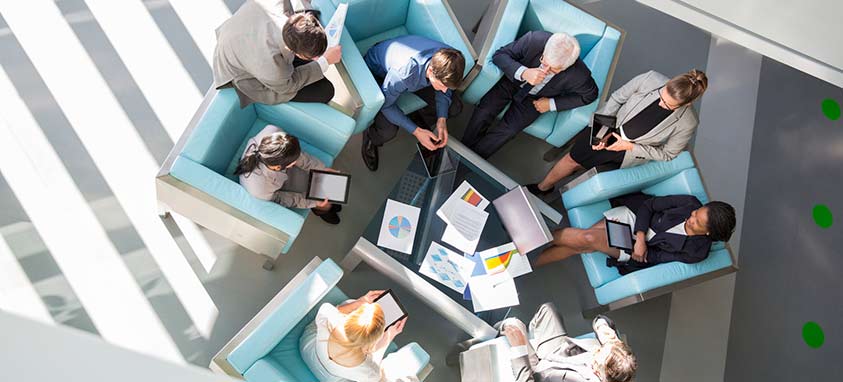
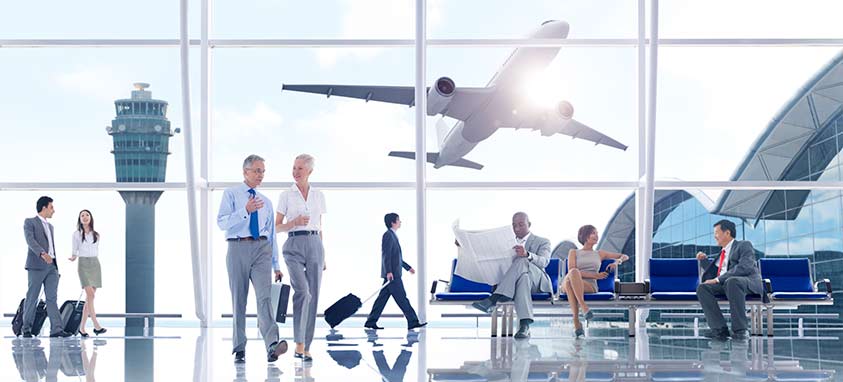
When was the last time you set foot in a hotel business center? If you are like most meeting planners, it was probably ages ago. While a well-equipped business center used to be a hallmark of a fine hotel, personal laptops, tablets and mobile devices have basically rendered them obsolete.

The Good Ole Days

Hotel business centers came into popularity in the 1980s, when properties rushed to install banks of stationary PCs, printers and fax machines that could be rented on an hourly basis. At the more upscale hotels, they were complimentary.

Usually located in a far-off back room, they served a purpose for business travelers who needed to check their email, make quick changes to a presentation or transmit some documents. Yet oftentimes computers were glitchy, printers were low on ink and fax machines were out of paper. Despite their shortcomings, these centers were a mainstay in hotels that serviced a business clientele.

Reimagining the Business Center

Today, traditional business centers sit deserted as on-the-go workers use their own devices in their guest rooms, or more commonly in a communal space such as the hotel lobby. Larry Mogelonsky, founder of LMA Communications Inc. in Toronto, believes that moribund business centers present an opportunity for hoteliers, who can put the space formerly devoted to them to better use.

Blogging on hotelsmag.com, Mogelonsky offers the following suggestions for transforming and reimagining the hotel business center.

  • Open a grab-and-go cafe serving coffee, snacks and other food items that are rotated based on the time of day.
  • Use the space as a wedding or catering sales center where you can display linen and table settings.
  • Showcase local artists by developing an art gallery or pop-up store with rotating exhibits.
  • Open a mini-spa outlet where professionals proffer short massages or manicures.
  • If the center is large, turn it into a venue for small- to mid-sized events.
  • If you don’t want to completely abandon the notion of a business center, make it a portable amenity. Purchase two loaner laptops (one Mac and one PC) that guests can check out and borrow. A standalone printer can be stationed at the front desk with Bluetooth or wireless connection to the laptops.


emirates-airline-awards

Airlines based in the Arabian Gulf and Asia definitely have developed better reputations than U.S.-based airlines, according to the 2016 Skytrax World Airline Awards presented during Farnborough International Airshow in England.

While Emirates from Dubai, Qatar Airlines and Singapore Airlines took the top three spots in the airline awards voted on by customers from around the world, the top U.S.-based airline, Virgin America, ranked No. 25.

“We are honored to be recognized by the prestigious Skytrax awards,” says Tim Clark, president of Emirates. “Emirates has always put our customers at the heart of what we do, and we work hard to deliver the very best experience possible to our customers at every touchpoint, every day, all around the world. We constantly invest in our product and services, both on the ground and in the air. We listen carefully to our customers, and then relentlessly challenge ourselves to deliver and exceed expectations. The fact that these awards are based on the direct feedback from passengers is gratifying and wonderful recognition for all of the hard work that’s gone into creating the Emirates experience.”

Emirates has won the top prize four times, but showed quite a bit of improvement over 2015 when it was No. 5. The airline also won the World’s Best Inflight Entertainment award.

It was the second-straight year that Virgin America was named the Best Airline in North America. Based in San Francisco, Virgin America also earned Best Low Cost Airline in North America.

“It is an incredible honor to be named the Best Low Cost Airline in North America, and the Best Airline in North America, the latter for the second consecutive year in the prestigious World Airline Awards,” says David Cush, president and CEO. “This distinction is a testament to our approximately 3,000 teammates who are so passionate about their work. Thanks to them, over the past nine years, we’ve been able to revolutionize the industry and create an airline that people actually love flying.”

Delta was the second-best U.S. airline at No. 35. Jet Blue was No. 53, followed by Alaska Airlines at No. 60, Southwest at No. 66 and United at No. 68.

Thai Airways was named World’s Most Improved Airline and its premium spa facility in Bangkok was selected as Best Airline Lounge Spa Facility.

For the fifth time, Air New Zealand earned World’s Best Premium Economy Class, in addition also securing the award for Best Premium Economy Seat.

 2016 Rating Airline 2015 Rating
1 Emirates 5
2 Qatar Airways 1
3 Singapore Airlines 2
4 Cathay Pacific 3
5 ANAs 7
6 Etihad Airways 6
7 Turkish Airlines 4
8 EVA Air 9
9 Qantas Airways 10
10 Lufthansa 12
11 Garuda Indonesia 8
12 Hainan Airlines 22
13 Thai Airways 19
14 Air France 15
15 Swiss Int’l Air Lines 14
16 Asiana Airlines 11
17 Air New Zealand 17
18 Virgin Australia 16
19 Austrian 13
20 Bangkok Airways 23
21 Japan Airlines 21
22 Dragonair 18
23 AirAsia 25
24 KLM 28
25 Virgin America 26

bleisure-travel

Contrary to some reports, bleisure trips have not been increasing worldwide, according to a recently released white paper.

The paper, A Quantitative Look at the Bleisure Phenomenon, was based on a study by Carlson Wagonlit Travel’s CWT Solutions Group that looked at business trips booked by the company from 2011 to 2015.

Bleisure trips combine business with leisure, and for the purposes of the study they were defined as those that include a Saturday night leisure stay at the beginning or end of a trip, or both. The study found that every year, 20 percent of business travelers take bleisure trips and that they account for 7 percent of all business trips. These percentages were largely unchanged during the five years covered in the study.

An analysis of the results shows that young professionals, women and infrequent travelers are the demographic groups most likely to take bleisure trips.

Travelers under 25 years old are two to three times more likely than those 45 to 50 years old to add a weekend to a business trip. Women reported taking fewer business trips than men, but they took 1.7 percent more bleisure trips. Travelers taking 20 trips or more per year are less than 5 percent likely to take a bleisure trip during a given year, and take 8 percent of all bleisure trips, compared with one-third taken by employees traveling once or twice per year.

The distance between the origin and destination cities also affects bleisure rates. Long-distance travelers are more likely to take bleisure trips than those travel short distances. For example, the bleisure rate for people flying from San Francisco to London is 23 percent; by contrast, it’s 2 percent for those flying from Paris to London.

Global Business Travel Spend R

Global business travel spend topped $1.2 trillion in 2015, growing 5 percent over 2014, and is projected to reach 1.3 trillion in 2016 according a global economic study released this week by Global Business Travel Association (GBTA) Foundation. The GBTA BTI Outlook – Annual Global Report & Forecast predicts global business travel spend to advance 5.8 percent on average over the next five years, reaching $1.6 trillion in 2020, despite continued global uncertainty.

“Global business travel remains a critical driver of the success of organizations around the globe,” said Michael W. McCormick, GBTA executive director and COO. “Business travel has demonstrated a tremendous resiliency as it continues slow and steady progress even in the face of global uncertainty, a weakened global economy, terrorist attacks, world health issues and other obstacles. Companies across the globe clearly understand the return on investment business travel delivers for their bottom line.”

Total Business Travel Spending: Top 15 Markets (2015)

Country Total BTS ($ Billion) Annual Percentage of  Growth
China $291,276 11.4%
United States $289,837 2.2%
Germany $63,534 9.8%
Japan $62,101 1.0%
United Kingdom $47,138 8.3%
France $37,103 3.0%
South Korea $32,598 1.5%
Italy $31,621 2.2%
Brazil $30,521 -4.1%
India $29,629 11.0%
Canada $23,134 2.7%
Australia $21,767 6.4%
Spain $19,393 7.8%
Netherlands $18,160 2.0%
Russia $ 17,241 -18.2%
Global $1,236,848 5.0%

Growth Across Asia

At $291 billion, China surpassed the United States as the largest business travel market in the world with $291 billion in annual business travel spend last year. China’s economic growth continues to moderate, and GBTA forecasts their business travel market will be the fifth fastest growing major market in the world over the next five years.

Despite declines in growth, China remains the largest single market opportunity for travel suppliers and marketers as their $291 billion market size, coupled with 8.4 percent average growth, will lead to the largest gains in spending of any major market by far. Both India and Indonesia are predicted to average double-digit growth in business travel spending over the next five years.

Aftermath of Brexit

The annual report was compiled before the U.K. voted for Brexit on June 23, but the added uncertainty the vote brings will likely be felt on business travel. The financial upheaval and pending changes to trade and immigration rules are expected to raise concerns among business management, causing some postponement and outright cancellation of trips. If the U.K. does enter a mild recession, domestic and outbound business travel is also expected to suffer. On the other hand, a weaker pound will make leisure and business travel to the U.K. more affordable.

Domestic Slowdown

Expectations are slightly downgraded for the United States. The report projects only 0.9 percent growth in U.S. business travel this year to $292.5 billion. In 2017, spending is estimated to increase by 4.2 percent to $304.9 billion. Increasing variables in domestic and global economies; uncertainty leading up to the U.S. presidential election; the surprising vote from the U.K. to leave the EU; and continued signs of a weakening global economy have combined to influence a more pessimistic outlook for U.S. business travel over the next six months.

“The slow growth environment of the U.S. and global economies has taken a toll on many fronts leading to this ‘new normal’ of slow, but steady one to two percent progress,” said McCormick. “When growth does re-accelerate, companies must be ready with the newest technologies, the most productive workforce and the critical customer relationships necessary to take full advantage.”

Summer Travel tips

With large-scale events taking place in major travel hubs over the next few months, summer travel is predicted to be busier than ever. In a survey of nearly 200 frequent business travelers, more than 40 percent were concerned about longer airport security lines and increased wait times, according to GroundLink, a black car service. Twenty percent of travelers believe airline delays will cause the most stress, followed by 15 percent concerned about unequipped Transportation Security Administration (TSA) staff screening an increased number of passengers. By avoiding certain airports and planning ahead, business travelers can lower the risk of travel-related delays.

Long Airport Lines

Despite the growing list of airport concerns, more than 80 percent of business travelers said they will maintain their travel plans this summer. Fifteen percent said they will plan to avoid airports with long security wait times. According to those surveyed, the top five worst airports for security wait times are: John F. Kennedy International Airport (JFK), Chicago O’Hare International Airport (ORD), LaGuardia Airport (LGA), Newark Liberty International Airport (EWR) and Los Angeles International Airport (LAX).

The worst airports for flight delays are: LaGuardia Airport (LGA), Chicago O’Hare International Airport (ORD), John F. Kennedy International Airport (JFK), Newark Liberty International Airport (EWR) and Hartsfield-Jackson Atlanta International Airport (ATL).

Expedited Security

More than 57 percent of business travelers surveyed participate in either TSA PreCheck or Global Entry programs, which expedite the security process. Sixty-three percent said these programs are beneficial to passengers, especially during the summer months. Of those not enrolled in either program, 20 percent would apply this summer. Another 36 would not apply, while 43 percent remain undecided.

Political and Olympic Events

This month, the Republican National Convention takes place July 18-21 in Cleveland. A week later, the Democratic National Convention happens July 25-28 in Philadelphia. Travelers are advised to bypass these cities’ airports in the following weeks. Following the U.S. political conventions, the 2016 Summer Olympics in Rio De Janeiro take place Aug. 5-21, drawing thousands spectators from around the world. It is recommended that business travelers avoid traveling to Brazil next month. The risk of contracting the Zika virus is also present.

Troublesome Travelers

Survey participants pointed to two groups of travelers they believe are likely to cause disruptions. GroundLink reported that 29 percent of respondents were leery of families traveling together, and 28 percent believed male travelers are most likely to cause problems. According to 19 percent, children were very likely to misbehave on flights, and 5 percent thought women were most disruptive.

Unforeseeable Delays

There are always some delays which cannot be predicted or prevented, and most travelers understand the risk of these variables. A small percentage of those surveyed were concerned about such issues, with 5 percent refusing to fly altogether. Weather-related delays, such as summer thunderstorms, troubled 7 percent of travelers. Four percent cited an increase in air turbulence and mechanical issues as cause for alarm. Terrorism and airport safety worried 7 percent of respondents.

hospitality-trends

As hotel guests increasingly come to expect amenities that used to be special perks, such as free Wi-Fi, complimentary breakfasts and premium bed linens, the industry may be reaching a customer satisfaction plateau, according to the J.D. Power 2016 North America Hotel Guest Satisfaction Index Study,SM released today.

The study, now in its 20th year, measures overall guest satisfaction across eight hotel segments: luxury; upper upscale; upscale; upper midscale; midscale; economy/budget; upper extended stay; and extended stay. Seven key measures are examined in each segment to determine overall satisfaction: reservation; check-in/check-out; guest room; food & beverage; hotel services; hotel facilities; and cost & fees. Satisfaction is calculated on a 1,000-point scale.

Although overall satisfaction has improved for a fourth consecutive year, increasing by 2 points from 2015 to average 806, this represents a much smaller increase than in recent years. In past years, strong improvements in cost & fees played a key role in improving satisfaction overall. While satisfaction with cost & fees improved by 25 points between 2014 and 2015, this year it has improved by only 1 point.

“Customers have responded well to the enhanced offerings provided by some hotel brands to create value, but as those perks become standard, customers are quick to ask, ‘What have you done for me lately?’” said Rick Garlick, global travel and hospitality practice lead at J.D. Power. “When guests no longer see added value in the quality of amenities they receive, the only option to truly differentiate a brand is to develop a strong service culture that makes guests feel special and appreciated.”

Interestingly, while satisfaction in most segments has remained flat, the luxury segment has improved by 12 points overall. Much of this improvement is attributed to a 20-point improvement in cost & fees.

“Despite luxury hotels typically being the most expensive, this segment has been able to show guests that they’re providing additional value, which is clearly resonating,” said Garlick.

The study also finds that while satisfaction is higher among members of hotel rewards programs than among non-members, younger guests are less likely to be members than older guests. Only 39% of Gen Y guests belong to a rewards program, compared with 56% of Gen X and 66% of Boomer guests. In every generational group, customer satisfaction is significantly higher among guests who are rewards program members.

“We’re finding that every succeeding generation seems to be less likely to be a member of a hotel rewards program than the one before,” said Garlick. “As we’ve seen across numerous industries that J.D. Power tracks, younger guests in particular are especially driven by the value proposition, underscoring the importance for hotel brands to make a stronger case for the benefits of loyalty to these travellers.”

Following are some of the key findings of the study:

-Online/Mobile check-in: Only 3% of guests take advantage of online or mobile check-in, though check-in/check-out satisfaction is highest among these guests than among those who used any other method.
-Most important amenities: The three most important amenities cited by guests are free Wi-Fi, breakfast and parking. In terms of hotels providing these amenities, 71% of guests say they received complimentary Wi-Fi; 56% received complimentary breakfast; and 61% received free parking. Luxurious bedding and linens, the fourth-most important amenity, is becoming increasingly important; however, only 37% of guests say this was offered in their room.
Social media feedback:
Among guests who posted something about their stay on social media, 75% of the posts were positive, compared with 13% that were negative. Overall satisfaction is 40 points higher among guests who post comments to social media.

Hotel Segment Rankings

The following hotel brands rank highest in guest satisfaction in their respective segments:

-Luxury: The Ritz-Carlton (for a second consecutive year)
-Upper Upscale: Omni Hotels & Resorts (for a second consecutive year)
-Upscale: Hilton Garden Inn
-Upper Midscale: Drury Hotels (for 11 consecutive years)
-Midscale: Wingate by Wyndham (for a second consecutive year)
-Economy/Budget: Microtel Inn & Suites by Wyndham (for a fourth consecutive year)
-Upper Extended Stay: Hyatt House
-Extended Stay: Home2 Suites by Hilton

Notably, The Ritz-Carlton earns the highest score in the history of the study at 896.

The 2016 North America Hotel Guest Satisfaction Index Study is based on responses gathered between June 2015 and May 2016 from more than 63,000 guests in Canada and the United States who stayed at a hotel in North America between May 2015 and May 2016.

healthiest-american-cities

Meeting planners travel to many American cities; some of which are healthier than others. 24/7 Wall St. recently crunched health data from the County Health Rankings and Roadmaps program, a collaboration of the Robert Wood Johnson Foundation and the University of Wisconsin Population Health Institute, in order to determine which American cities are the healthiest.

Their conclusion? Rochester, Minnesota, home of the renowned Mayo Clinic, is the healthiest city in America. Rochester adults report an average of just 2.4 physically unhealthy days per month, the lowest in the country. When they require medical attention, the ratio is 180 primary care physicians for every 100,000 residents—more per capita than in any other city in America.

The other Top Five healthiest cities, according to 24/7 Wall St., are the San Jose, California metropolitan area; Ames, Iowa; Boulder, Colorado; and Iowa City, Iowa.

Methodology

To come up with its list, 24/7 Wall St. examined more than two dozen health factors related to quality and length of life in cities across the country, including the premature death rate, adult obesity rate, the percent of adults without health insurance and the median household income.

They emphasize that premature death is the single most important factor in rating the overall health of a city, noting that residents in the 25 healthiest American cities are far less likely to die before age 75. Data on life expectancy came from the Institute for Health Metrics and Evaluation, a global health research center affiliated with the University of Washington.

Key Findings

-Income plays a significant role, as the wealthy can afford medical treatment and good quality food. In most of the locations that made 24/7 Wall St.’s healthiest cities list, the median household income exceeds the national average. For example: In the San Jose metropolitan region, which came in No. 2 in the rankings, the median income is $92,960 annually—more than any other American city.

-Health insurance coverage is also significant because those who have it are more likely to seek preventative medical screening and treatment. The uninsured are more likely to be diagnosed with disease later, when treatment outcome is less optimistic. The percent of uninsured individuals in the healthiest American cities are all far below than the national rate.

When compiling the list, researchers also took healthy behaviors, clinical care, social and economic factors, and physical environment measures into consideration. Smoking and obesity have a direct correlation on health. Across the country, 17 percent of adults are smokers and 27 percent are obese. Not surprisingly, the healthiest cities had significantly lower percentages of smokers and obese residents.

While cities all across the nation made the Top 25 list, certain states were more represented than others. Minnesota had the most locations, securing four spots in the Top 25: Rochester (No. 1); Mankato (No. 9); St. Cloud (No. 12); and Minneapolis/St. Paul/Bloomington (No. 13). California, often associated with good health, snagged three spots: the San Jose metropolitan area (No. 2); the San Francisco Bay Area (No. 14); and Santa Rosa (No. 20). Iowa and Wisconsin were also well-represented, with three regions each on the list.

While none of the nation’s largest metropolises (Los Angeles, New York, Chicago, Miami or Las Vegas) made the list, many mid-size cities such as Ann Arbor, Michigan; Madison, Wisconsin; Lincoln, Nebraska; and Lawrence, Kansas did.

List of the 25 Healthiest Cities

Here, in order, is the 24/7 Wall St. list of the 25 healthiest cities. To learn more about why each one made the list, visit 247wallst.com.

1. Rochester, Minnesota
2. San Jose-Sunnyvale-Santa Clara, California
3. Ames, Iowa
4. Boulder, Colorado
5. Iowa City, Iowa
6. Provo-Orem, Utah
7. Logan, Utah
8. Burlington-South Burlington, Vermont
9. Mankato-North Mankato, Minnesota
10. La Crosse-Onalaska, Wisconsin
11. Fort Collins, Colorado
12. Cloud, Minnesota
13. Minneapolis-St. Paul-Bloomington, Minnesota
14. San Francisco-Oakland-Hayward, California
15. Fargo, North Dakota
16. Corvallis, Oregon
17. Lincoln, Nebraska
18. Dubuque, Iowa
19. Appleton, Wisconsin
20. Santa Rosa, California
21. Madison, Wisconsin
22. State College, Pennsylvania
23. Ann Arbor, Michigan
24.
Lawrence, Kansas
25. Portland-South Portland, Maine

Spectator-CharlestonThe 2016 Travel + Leisure World’s Best awards were announced on July 6, and if there’s a theme among the Top 100 Hotels in the World it’s that “boutique is better.”

The Spectator in Charleston, South Carolina, and Montage Kapalua Bay in Lahaina, Maui, Hawaii, were ranked No. 2 and No. 4, respectively, by Travel + Leisure’s annual readers’ survey. Respondents rated properties on a five-point scale based on five characteristics: rooms/facilities, location, service, restaurants/food and value.

Since opening last year, The Spectator’s location in the heart of Charleston’s Historic District has helped create buzz over the 41-room boutique property. But what helps sets The Spectator apart from its peers are personal butler service and captivating design that reflects Art Deco style with Southern charm. For example, the lobby’s opulent chandelier features 1,800 hand-strung crystals and a Speakeasy-style bar. There’s meeting and event space for up to 50.

“It is a remarkable accomplishment that within its very first year of opening, The Spectator is already acknowledged by Travel + Leisure readers as the best city hotel in the country,” said Michael Tall, president and chief operating officer of Charlestowne Hotels which manages The Spectator. “This is a testament to the hotel team’s commitment to high-touch, curated guest experiences–one of the cornerstones of our hotel management process, and a mainstay of the exceptional service culture and superior guest relations Charlestowne Hotels provides at all of our managed properties.”

The No. 1-rated hotel was Nihiwatu, Sumba, Indonesia.

Montage Kapalua Bay is among the world’s best hotels because of location as well. One of the Hawaiian Islands’ main leisure destinations, Lahaina, Maui, has a resort worthy of business events and incentive trips thanks to the Montage. The 50-room Forbes Five Star property has outdoor lawn space for up to 1,000 and indoor meeting space for 125.

World’s Best Hotels

Here are other U.S. properties that were among the top half of Travel + Leisure World’s Best Hotels.

6. The Lodge at Glendorn, Bradford, Pennsylvania

7. The Wilcox, Aiken, South Carolina

9. Twin Farms, Barnard, Vermont

12. Farmhouse Inn, Forestville, California

16. Gateway Canyons Resort & Spa, Gateway, Colorado

22. Triple Creek Ranch, Darby, Montana

25. Wequassett Resort & Golf Club, Chatham, Massachusetts

26. Old Edward Inn & Spa, Highlands, North Carolina

27. Weekapaug Inn, Westerly, Rhode Island

34. XV Beacon, Boston, Massachusetts

37. Rosewood Sand Hill, Menlo Park, California

45. Lodge at Sea Island, Sea Island, Georgia

46. The Lodge and Cottages at Primland, Meadows of Dan, Virginia

49. Gasparilla Inn, Boca Grande, Florida

50. Rancho Vallencia Resort & Spa, Rancho Santa Fe, California

travel-trends-sharing-economy

According to the Allianz Travel Insurance Sharing Economy Index released by Allianz Global Assistance USA, more than a third of Americans say they likely plan to use sharing economy services during their summer vacations. Such services include AirBnB, HomeAway, Uber and Lyft.

“We’re at an interesting intersection right now between sharing economy and traditional services,” said Daniel Durazo, director of communications at Allianz Global Assistance USA. “The playing field is quite level with many Americans having an uncertainty about which services provide the better experience, which opens an opportunity for the lesser known sharing economy to take a bigger stake as awareness continues to increase. There was already significant growth in use, familiarity and trust of the sharing economy over the last year showing that these services are not a fad and have great potential for longevity.”

Sharing Economy Trends

The survey concludes that 36 percent of Americans likely plan to use a sharing economy service this summer. That number saw a significant increase from Allianz’s 2015 report when just 17 percent of Americans said they were likely to use such services.

How Americans Feel About Sharing Economy Services:

2015 2016
Familiarity 47% 62%
Trust 44% 48%
Likely to Use 17% 36%

Millennials lead the way regarding reliance on the sharing economy, with 65 percent of 18-34 surveyed saying they are likely to use these services. This number also saw a significant jump, up 37 percent from the 2015 report.

In a sign that travelers in general are more comfortable with sharing economy services, those in the 35-54 age group report that 33 percent are likely to use a service. That figure dips to 14 percent for those 55-and-over.

Familiarity and trust are big reasons sharing economy services are more popular than ever. Eighty-six percent of millennials say they are familiar with the sharing economy services compared to 58 percent who said the same last year. Familiarity and trust are keys among other age groups as well: 35-54 (67 percent) and 55-and-over (49 percent).

One somewhat surprising trend is that those with higher annual incomes have increased use of sharing economy services. The study reveals that Americans with an annual income of $50,000 or more (38 percent) are more likely to use sharing economy services than those with an income less than $50,000 (32 percent).

national-park-service

Have you ever held an event or arranged group activities at a U.S. national park? Maybe it was an executive retreat at a lodge or an incentive trip on mules to the bottom of the Grand Canyon.

Next month, August 2016, our National Park Service celebrates its 100th birthday. Created in 1916 under President Woodrow Wilson, the forward-thinking idea of the National Park Service and all that it’s done to preserve our natural and cultural wonders deserves to be applauded.

Share Your National Park Service Experiences

To help Smart Meetings celebrate, we are asking meeting planners and suppliers to share the coolest and most inspiring places to meet, network and explore in the U.S. National Park Service lands. Top suggestions will be featured in the August issue of Smart Meetings magazine and online.

Yellowstone National Park became the nation’s first national park, following an 1872 act by President Ulysses S. Grant. To help visitors take in the full beauty of this treasured destination, Old Faithful Inn was built in 1904. It is considered the largest log structure in the world. Boasting views of the famous geyser, the 329-room property is a National Historic Landmark and member of Historic Hotels of America.

Group tours in national parks and stays in historic lodges are full of incentive and team-building opportunities. Some national parks lodges even offer meeting space.

For example, did you know that Mount Rushmore National Memorial has its own 2,000-seat amphitheater? Special use permits may be issued to rent the venue from May 1−Oct. 31. Located 23 miles southwest of Rapid City, South Dakota, Mount Rushmore is one of the driving forces in tourism for the city and the state. Visages of U.S. presidents George Washington, Thomas Jefferson, Theodore Roosevelt and Abraham Lincoln are carved into a granite mountainside above the treetops of the Black Hills. Sculptor Gutzon Borglum and 400 workers completed this renowned work from 1927-1941.

What’s your favorite national park and why? Let us know.